TIDES:
Tides are the periodic rise and fall in level of seas. In mid ocean, where the depth of water is large, the tidal range is small, but where the waters are shallow, the tidal range increases. Various theories have been put forward for the cause of tides. The equilibrium theory advanced by Sir Isaac Newton is generally accepted as the major basis on which tides occur, since the actual tides observed are normally in general agreement with the tides computed according to this theory.
TIDE TERMINOLOGY
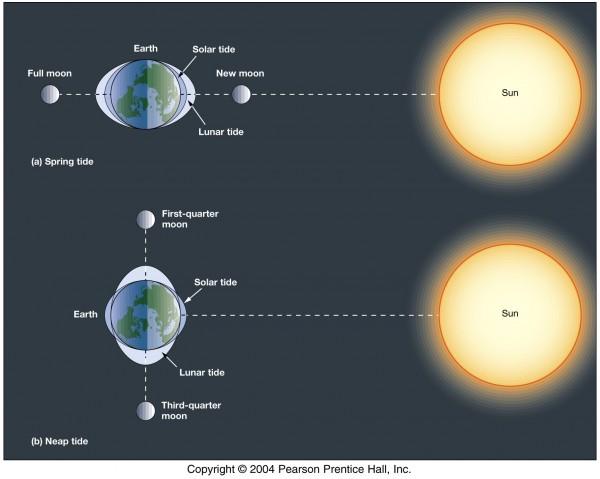
SPRING TIDES: At full moon and new moon days when sun is in conjunction and opposition with the moon, these two tide raising forces act in the same line producing very high high waters and very low low waters. The range of the tide would be large. These are known as Spring tides.
NEAP TIDES: When the moon is in its quadrature, the tide raising forces due to the sun and that due to the moon, act in direction 90 degrees to each other. The solar tide then tends to produce a high water at points where low water occurs due to lunar low waters and vice versa. Thus at such times the luni-solar high tides are not very high and the luni-solar low waters are not very low. Therefore, the range of the tides are not very large
.
EQUINOCTIAL AND SOLSTITIAL TIDES:
At the equinoxes in March and September, when declinations of the moon and the sun are both zero, the semi-diurnal (2 high and 2 low waters a day), luni-solar tide raising forces will be at its maximum, thus causing equinoctial tides. Tides greater than spring tides will occur.
At the solstices in June and December, when the declinations of the moon and the sun are both maximum, the diurnal (1 high and 1 low water a day) luni-solar tide raising forces will be at maximum, thus causing solistitial tides. Spring tides lower than the usual will occur
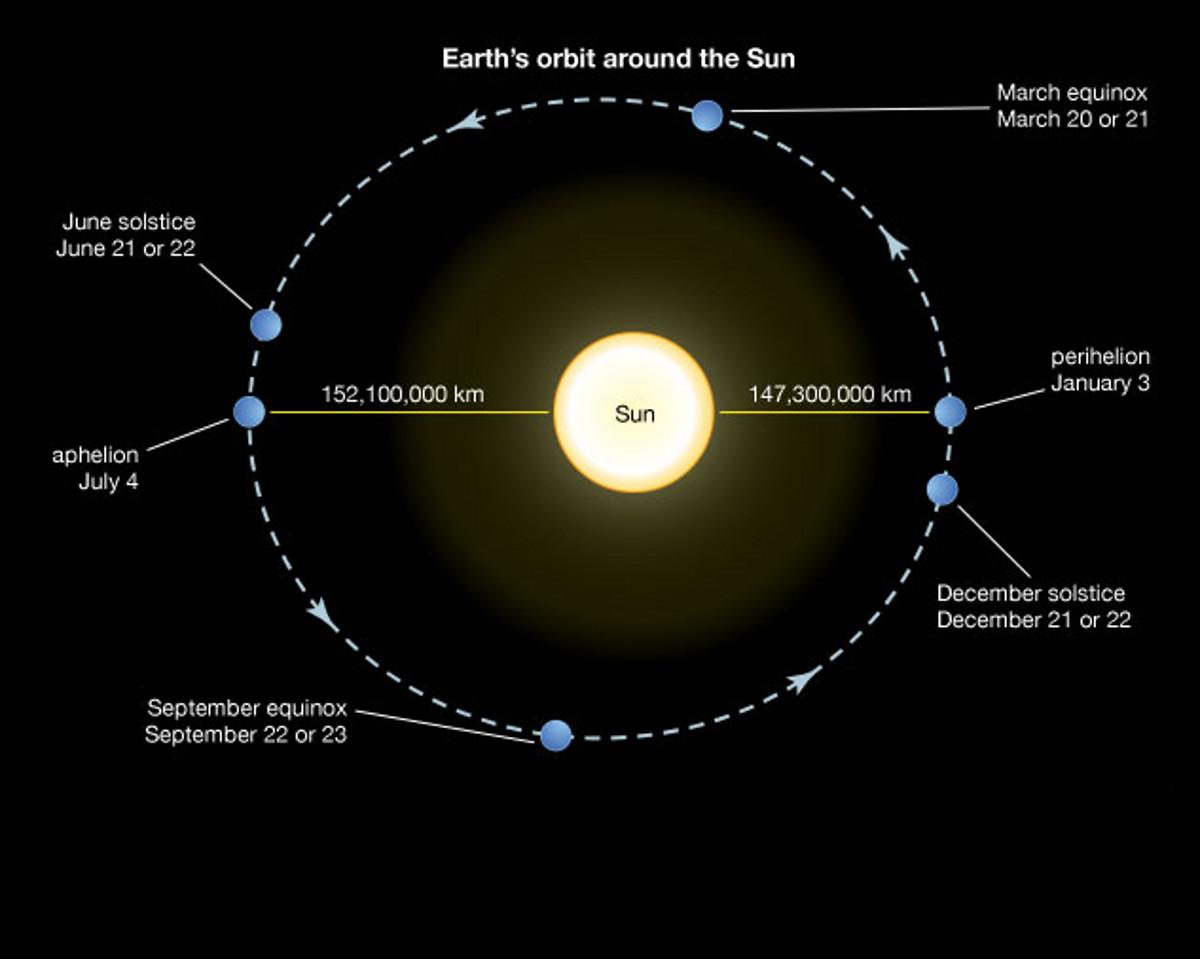
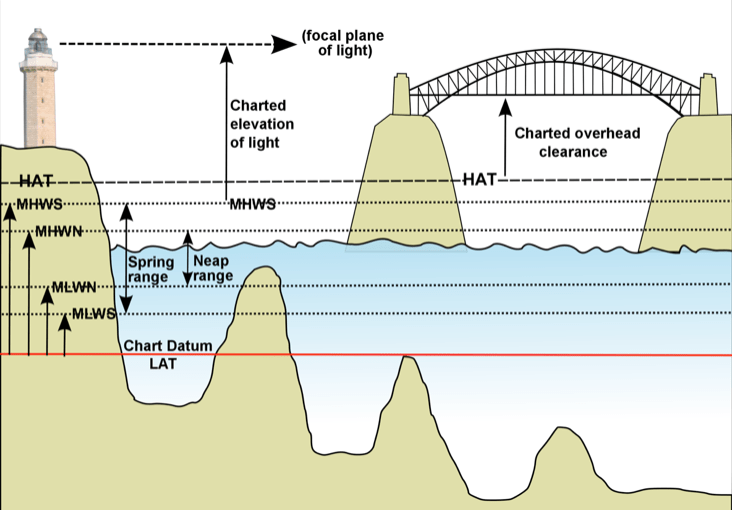
CHART DATUM:
The low water reference level to which all depths indicated on the chart and the heights of all features which are periodically covered and uncovered by the sea is called chart datum. The datum is so chosen that the water level will not fall below that level.
HEIGHT DATUM:
This is the datum from which heights of all shore structures as such as light houses is measured. Generally, it is the MHWS level.
HEIGHT OF TIDE:
It is the vertical distance between the chart datum and sea level at that time.
HIGH WATER:
The highest level reached by sea during tidal oscillations.
LOW WATER:
The lowest level reached by sea during tidal oscillations.
MEAN HIGH WATER SPRINGS
MHWS is the average height throughout the year, of two successive high waters during 24 hours in each semi lunation, when the range of tide is greatest.
MEAN HIGH WATER NEAPS:
MHWN is the average height, throughout the year of two successive high waters during a period of 24 hours, in each semi lunation when the range of tide is least.
MEAN LOW WATER SPRINGS
MLWS is the average height throughout the year, of two successive low water during the 24 hours in each semi lunation, when the range of tide is greatest.
MEAN LOW WATER NEAPS
MLWN is the average height throughout the year of two successive low waters during a period of 24 hours, in each semi lunation where range of tide is least.
THE VALUES OF MHWS, MHWN, MLWN and MLWS vary from year to year in a cycle of approx. 18.6 years.
HIGHEST ASTRONOMICAL TIDE(HAT):
These are the highest and lowest tides that are possible to predict at standard ports, under average meteorological conditions and under any combination of astronomical conditions. HAT and LAT are not extreme levels as there are conditions such as storm surges which may cause considerably higher or lower levels to occur.
FLOOD TIDE:
It’s the inflow of water due to rising tide.
EBB TIDE:
It is the outflow of water due to falling tide.
TIDAL STREAMS:
It is the periodical horizontal movement of sea water due to tide raising forces of the sun and moon.
SLACK WATER:
It is the period when the tidal streams are the weakest.
EFFECT OF WEATHER ON TIDES:
Meteorological conditions which differ from average cause corresponding differences between the predicted and actual tide. Tidal predictions are computed for average barometric pressure. A low barometric pressure tends to raise the sea level, whereas a high pressure tends to lower the sea level.
The effect of wind on sea level depends largely on the topography of the coast line. Wind tends to raise the sea level in direction towards which it is blowing.
TIDES CAN BE
SEMI DIURNAL - 2HIGH AND 2 LOW WATERS
DIURNAL - 1 HIGH AND 1 LOW WATER
MIXED - A COMBINATION OF BOTH SEMI DIURNAL AND DIURNAL. (MIXED FEATURES OF BOTH)
Let’s see what is a Standard port and a secondary port
A Standard port is a port whose tidal predictions are directly given in the Tide tables. Secondary ports (also called Secondary place in some countries like Australia), on the other hand, are ports for which tides have to be calculated, based on a primary port with a similar tidal curve.
Standard port has the daily prediction of tide for a year given in the tide tables , for secondary ports we have to determine the tide by calculation.
ADMIRALITY TIDE TABLES- LAYOUT AND USE
Admiralty tide tables are published annually in four volumes for world-wide coverage as follows.
VOLUME 1- UNITED KINGDOM AND IRELAND (EXCLUDING EUROPEAN CHANNEL PORTS)
VOLUME 2- EUROPE (EXCLUDING UNITED KINGDOM AND IRELAND), MEDITERRANEAN SEA AND ATLANTIC OCEAN.
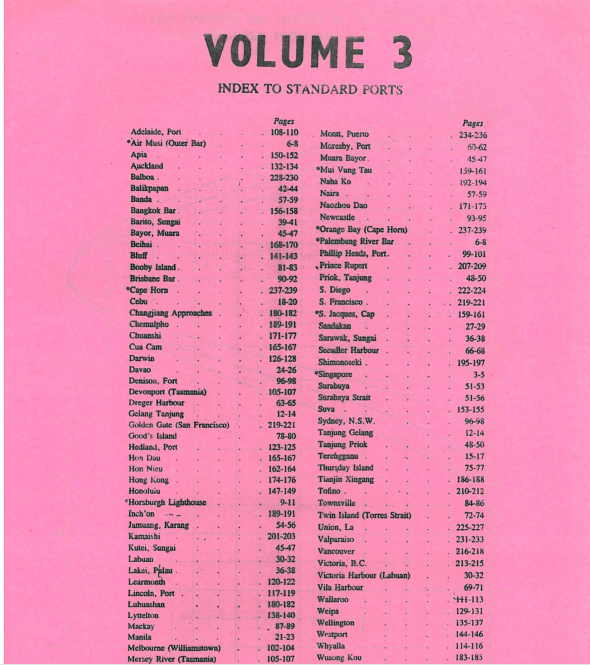
VOLUME 3-INDIAN OCEAN AND SOUTH CHINA SEA (INCLUDES TIDAL STREAM ATLASES)
VOLUME 4-PACIFIC OCEAN.
FOR THE PURPOSE OF EXAMINATIONS, WE USE THE SELECTED PAGES OF ADMIRALITY TIDE TABLES 1992 WHICH CONTAINS VOULME 1,2 AND 3.

LETS SEE THE LAYOUT OF THE TIDE TABLE.
For the ease of identification, the entire book is divided into 3 parts, Volume 1 is in the beginning, Volume 2 is coloured yellow and Volume 3 is Pink, this enables the user to easily get into the required volume for solving a question.


Each volume is divided into 3 parts.
PART 1: Gives the general information, including the daily predications of the times and heights of high and low waters at a selected number of Standard ports.

PART 2: Gives the data for predication of tides at a large number of Secondary ports, this is in the form of time and height differences referred to one standard port in Part 1.
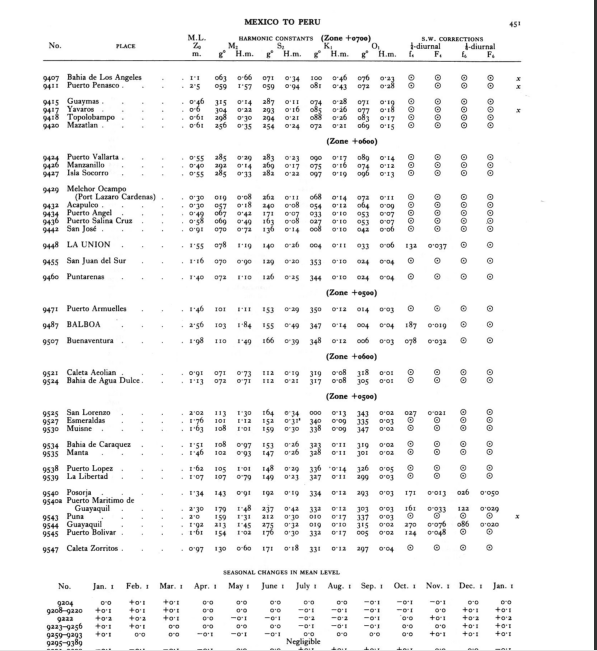
PART 3: Gives the harmonic constants for use with simple harmonic method of tidal predictions.
NOTE: FOR 2nd MATES WE USE THE INTERPOLATION METHOD AND NOT THE SIMPLE HARMONIC METHOD, THIS METHOD WOULD BE USED IN CHIEF MATES.
The first step would be to identify the port.
For example: We are asked to find the Standard port and number of Port BHARUCH.
So first instinct should be to check the index page in each volume, you will check the Geographical index rather than the Standard port index.
The geographical index of each volume can be found at the end of the volume after part 3.
This is the index to standard port

This is the Geographical index.
Step 2: Now upon checking geographical index of 1 and 3 we couldn’t find the port BHARUCH. This port was found in the geographical index of vol 2.
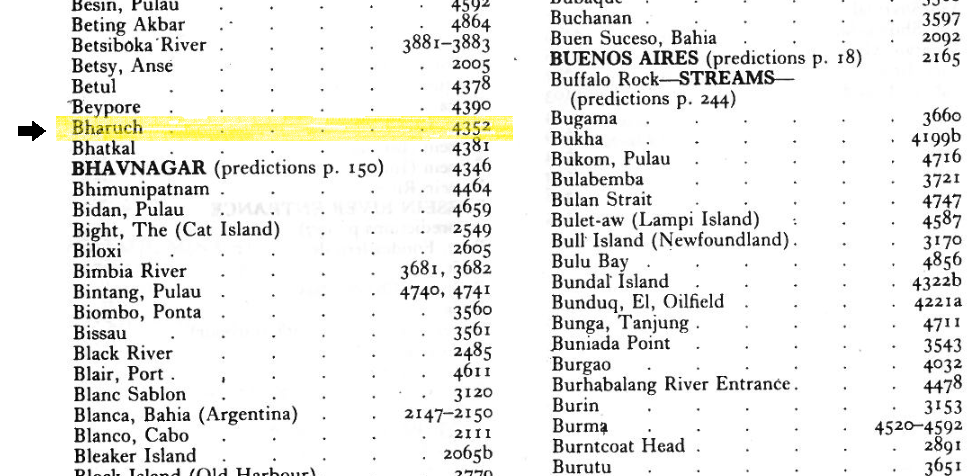
The numbering corresponding to the port name is the port number, with this we can identify the port.
Step 3: Now turn back few pages and go to the Part 2 of the same volume, i.e. vol 2. Here if you see there is a Standard port that has a port number followed by its Secondary port and its port number. There numbers are given in ascending order as per their groups. Now use the port number of Bharuch to identify the Standard port (use no. 4352)

Therefore, we get the standard port for Bharuch which is BHAVNAGAR and its number is 4346.
NOTE: YOU MAY NOTE THAT SOME INDIAN SECONDARY PORTS MAY COME UNDER THE STANDARD PORT OF ANOTHER COUNTRY.
EX: CALICUT, CANNANORE, TELLICHERRY ARE SECONDARY PORTS OF INDIA BUT COME UNDER THE STANDARD PORT KARACHI(PAKISTAN).
DO NOT COME UNDER AN IMPRESSION THAT THE STANDARD PORT AND SECONDARY PORT MAY BELONG TO SAME NATION.

LAYOUT OF VOL 1
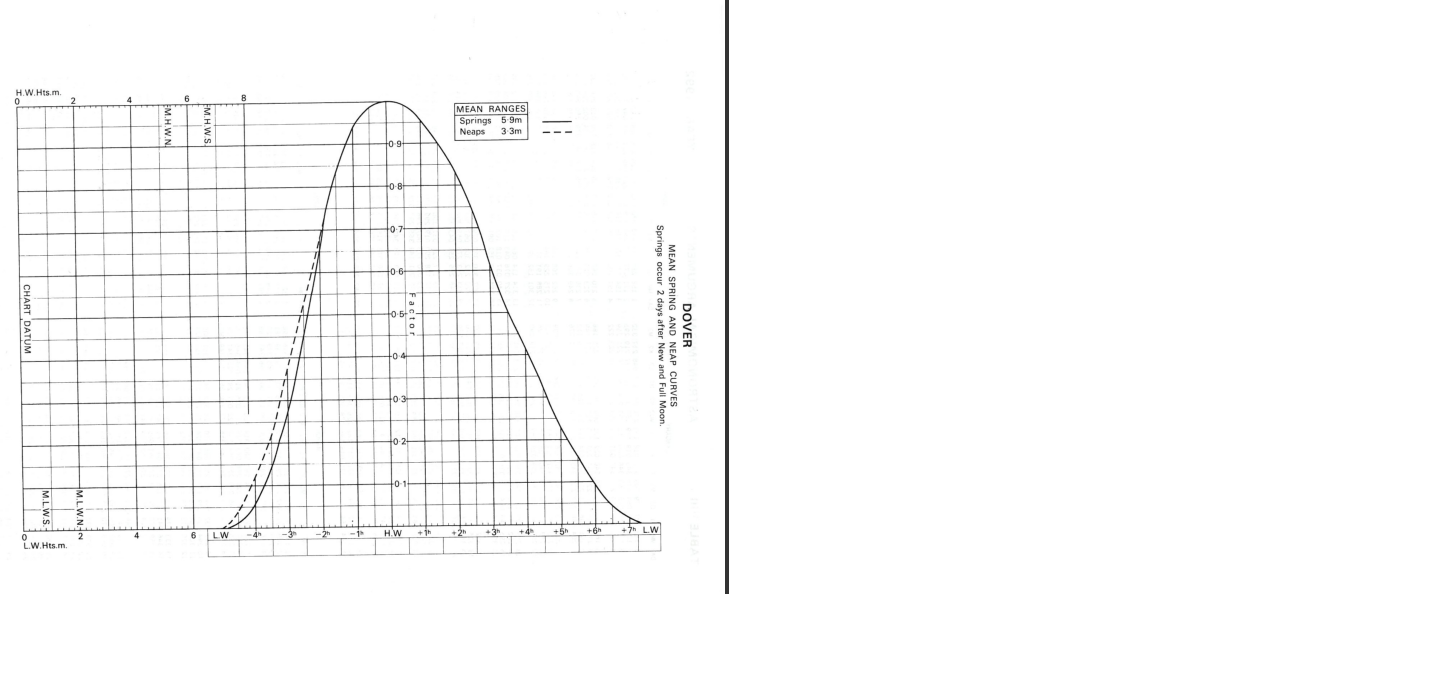
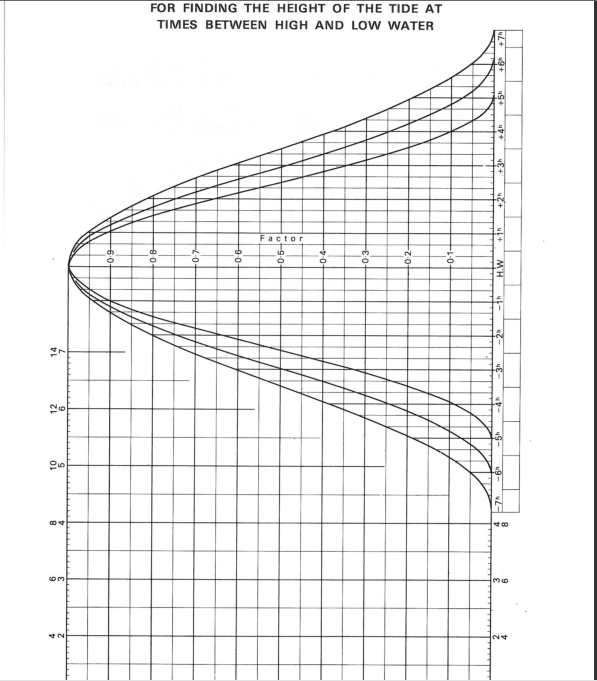
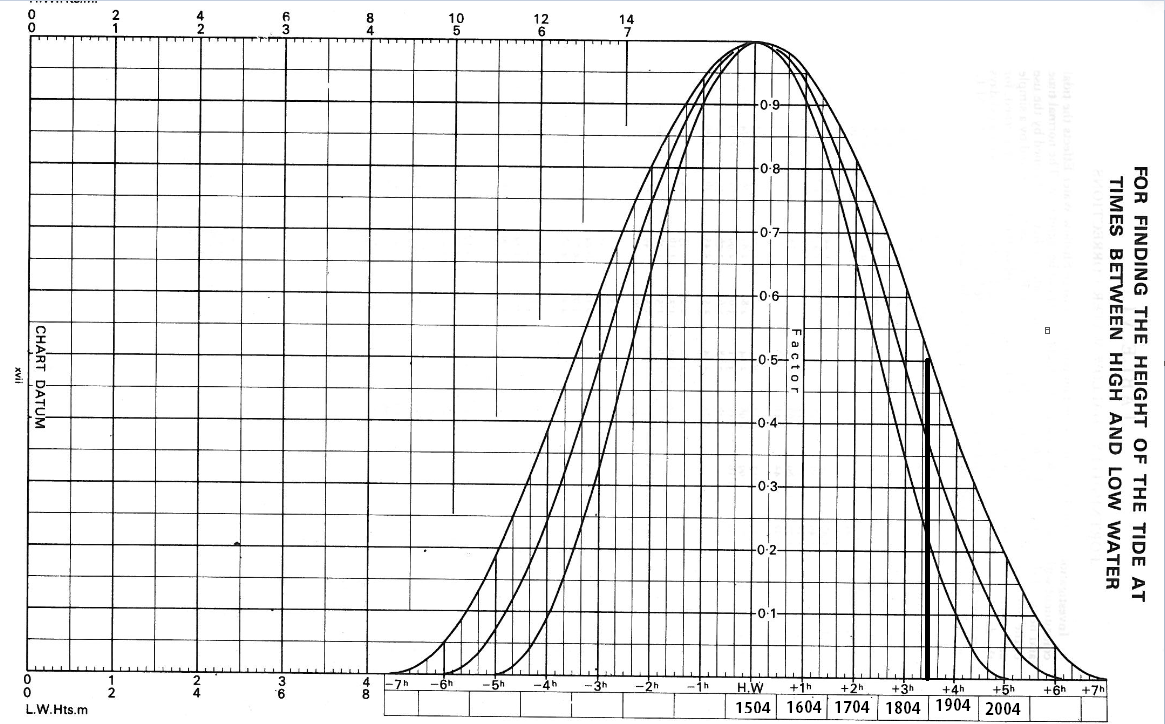
This is a standard curve diagram for a standard port. (here for Dover), This curve can be used to find the height of tide at any intermediate time/intermediate height for the standard port as well as the secondary port coming under this standard port.
This curve is only used to find the intermediate height or intermediate timings
FEATURES OF THE CURVE.

On the top left corner, you have the scale for the High water in meters.
The value of MHWS AND MHWN calculated is marked on the scale.

These are the height of MHWS and MHWN calculated for the standard port, the solid line is for MHWS and pecked line is for MHWN.

Here on the bottom left you can see the low water scale in metres. Also the values of MLWS and MLWN is indicated on the scale.

In this part of the curve, you can see at the centre HW is written, here you have to write down the value of HW on this basis of which you will find the intermediate height or time. Left of the HW is the time duration before high water, and right of it is the time duration after high water.

On the centre line of the curve you can see some factors, the use of factor is used to determine the height of tide. This is used to verify the answer we obtained by the interpolation method. The answer is verified by the formula-> Start point of range of tide + factor*(range of tide) = height of tide.
Where start point is the high water or low water between which you are determining the intermediate tide
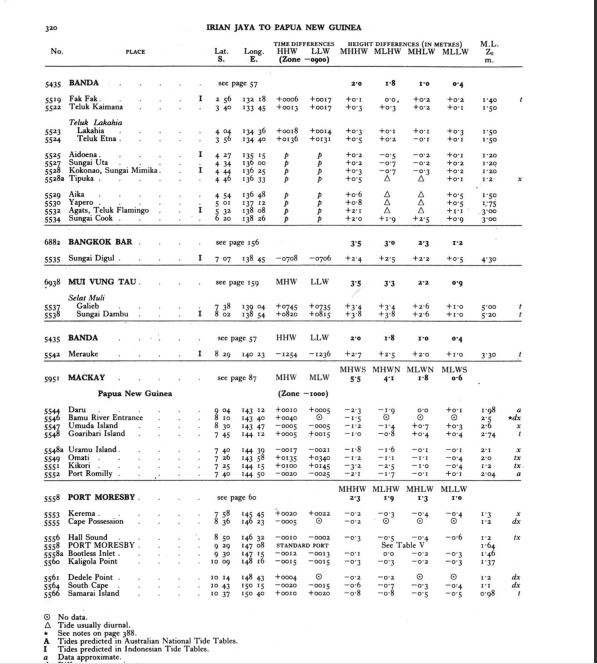
SOME FEATURES OF THE DAILY TIDE PREDICTION PAGE

SOME FEATURES OF THE CORRECTION PAGE FOR SECONADARY PORTS
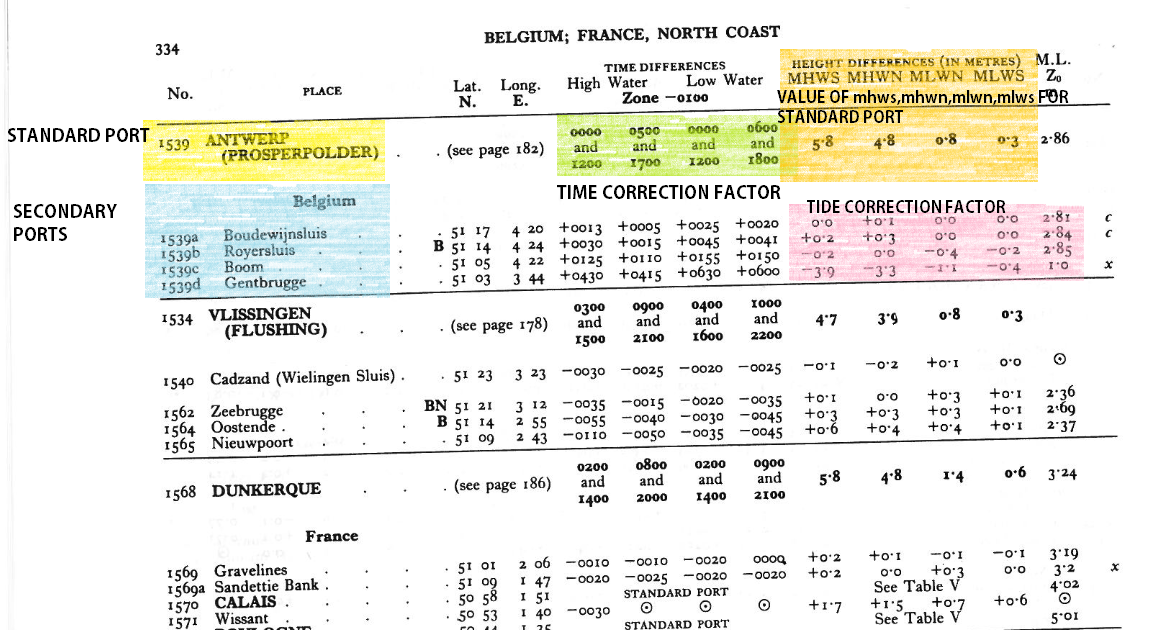
If someone asks you from where you can determine the value of MHWS, MHWN, MLWS, MLWN, we can find it from the correction pages, In case of volume 1 you can also find it on top right hand side of the curve.

Some points to remember before heading to any problem.
1.Be aware of the time zone, the zone time mentioned in the standard port is the legal/standard time at that place.
ZONE (-) 0530 means UTC= LOCAL TIME – 0530hrs
2. Daylight saving time should be accounted for. (Daylight saving time, also daylight savings time or daylight time and summer time, is the practice of advancing clocks during warmer months so that darkness falls later each day according to the clock.) If any port has daylight saving time during particular time of the year refer to the ALRS vol 2 and then you will have to apply that to the high water/low water times for the standard port.
For using the graphs and traditional method (using graphs and interpolation) a condition has to be satisfied i.e. the time difference between 2 successive tides should be between 5 to 7 hours.
If this is not satisfied, we have to use SHM method (not in 2M syallabus)
3.Each standard port and its associated secondary port has its own graph.
4.To find the intermediate heights and times of ports in volume 1,2 and 3, find the time difference between 2 successive tides, the difference should be between 5 to 7 hours. If this condition is not satisfied, we have to use the SHM (SIMPLE HARMONIC METHOD) (not in 2M syllabus)
5.As you can see below there are 2 curves in volume 1, one is a solid line indicating the MHWS and a pecked line indicating the MHWN.

6.To determine which curve has to be used we simply find out the range of the tide. i.e. the difference between the high and low water.
For ex: Let’s take – HOEK VAN HOLLAND NETHERLANDS
Let’s say we need to find the height of tide at 1500 hrs.
So this time falls between 1253hrs and 2117hrs
Therefore, the range of the tide is 1.9-0.3=1.6 mtrs.
7.So from the above we can see that the value 1.6 mtrs lies between the spring (1.9mtrs) and the neap(1.5mtrs).
8.Now since this value lies between the 2 curves, interpolate between the 2 curves and draw a new curve, like the one shown below, you can draw the curve on both sides and use as curve as per the question.
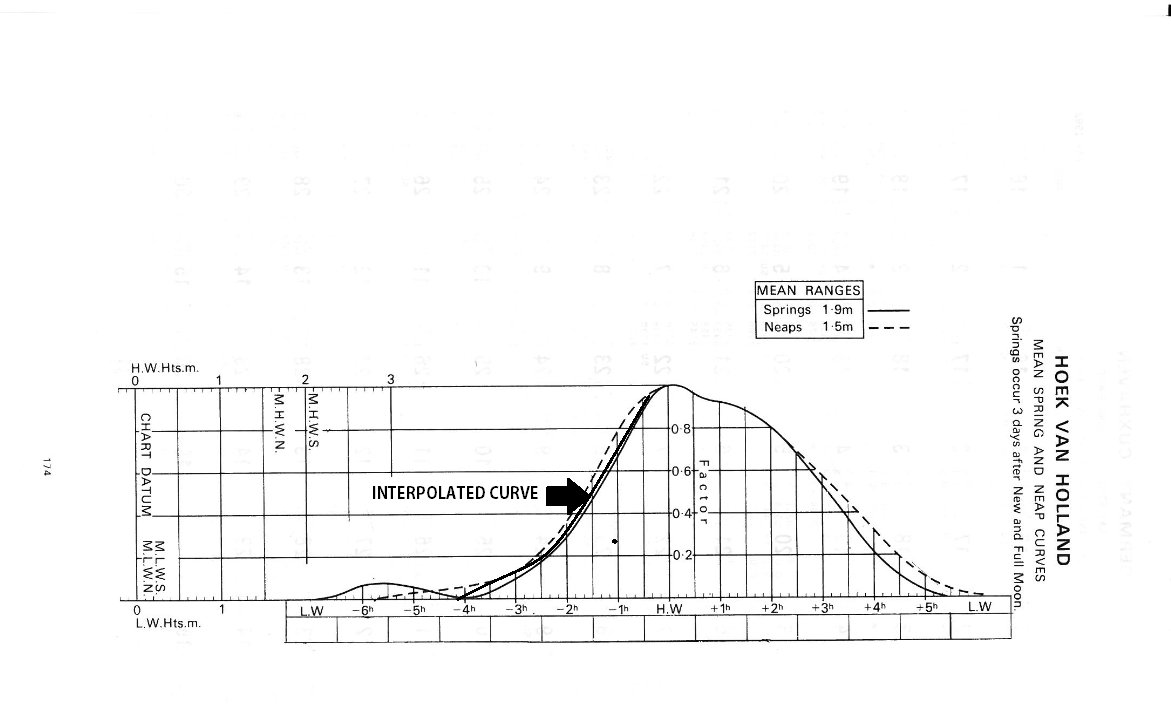
9.IMP: If the height difference(range) comes between the spring and neap tide we can interpolate and draw a new curve, but if the range is above the spring (MHWS) use the solid curve (spring curve) and if it is below the neap(MHWN) use the pecked curve (neap curve).
DO NOT EXTRAPOLATE THE CURVES.
10.In volume 1 we have an additional job of time interpolation in time correction for the secondary port (we will discuss this in the solved numerical)
11.For finding the intermediate time of a secondary port in volume 1 we will still use the height difference(range) of the STANDARD PORT ONLY. The height difference(range) of standard port will always be used to determine the curve to be used.
Let’s GO THROUGH SOME NUMERICALS:
1.FINDING HEIGHT OF TIDE AT AN INTERMEDIATE TIME.
Find the height of tide at 0630 hrs at Dover on 3rd march 1992.
Step1: Note down the local times and height of low and high waters.
Step 2: Draw a line joining the point 1.1 m (LW) on bottom left and 6m(HW) on top left.

Step 3: Now the time asked here is 0630 hrs, this lies between 0543 hrs and 1041 hrs, so now we will calculate the range of the tide which is 6.0-1.1=4.9 mtrs.
Step 4 : From the curve we see that the value of MHWS is 5.9m and MHWN is 3.3m
Step 5: The range 4.9 lies between spring and neap, therefore we need to interpolate to obtain the curve.
Step 6: Before this we will make the following entries in the curve,
The time asked 0630hrs is 04hrs and 11 minutes before high water, write down the HW timing in the centre and towards the left next to -4h draw a straight line vertically as shown below.


Draw a straight line vertically from 0630 hrs as shown above (interpolate between 0641 and 0541hrs)
Step 7: Now you need to interpolate between the curves. Instead of creating a whole new curve all together, take three or 4 points in the region between the 2 curves where the vertical line exists. Measure the distance between the curves using a scale.
Let’s say the distance between 2 curves at point is 0.5 cm
So for (5.9-3.3) difference btw MHWS AND MHWN =2.6m is 0.5 cm
Then for (5.9-4.9) =1m?
(1*0.5)/2.6=0.19~0.2
From the spring curve take 0.2 cm and make point
Repeat the same step at 3 different points. Now join these interpolated points, you will get the curve.as show below.

Step 8: This curve meets the vertical line at a point. Draw a horizontal line from this point to the line drawn in the beginning joining the high and low waters.

Step 9: From the point where the horizontal line meets the line joining the high and low waters, draw a line vertically, this will meet the high water scale at a point, this is the tide at 0630hrs.

Therefore, we obtain height of tide as 1.5 metres.
2.TO DETERMINE THE DAILY PREDICTIONS FOR A SECONDARY PORT.
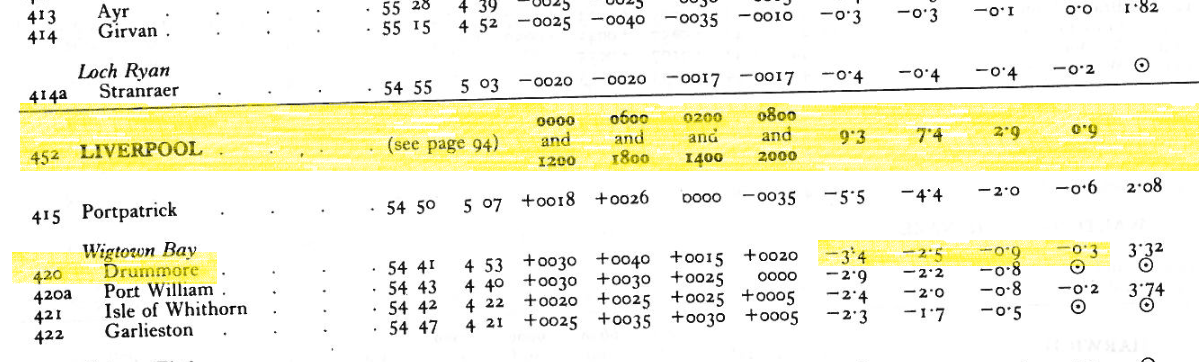
DETERMINE THE DAILY TIDES FOR PORT DRUMMORE (#420) ON 10th APRIL 1992.
Step 1: Determine the Standard port for Drummore using the port number given. (in MMD questions the port number will be given).
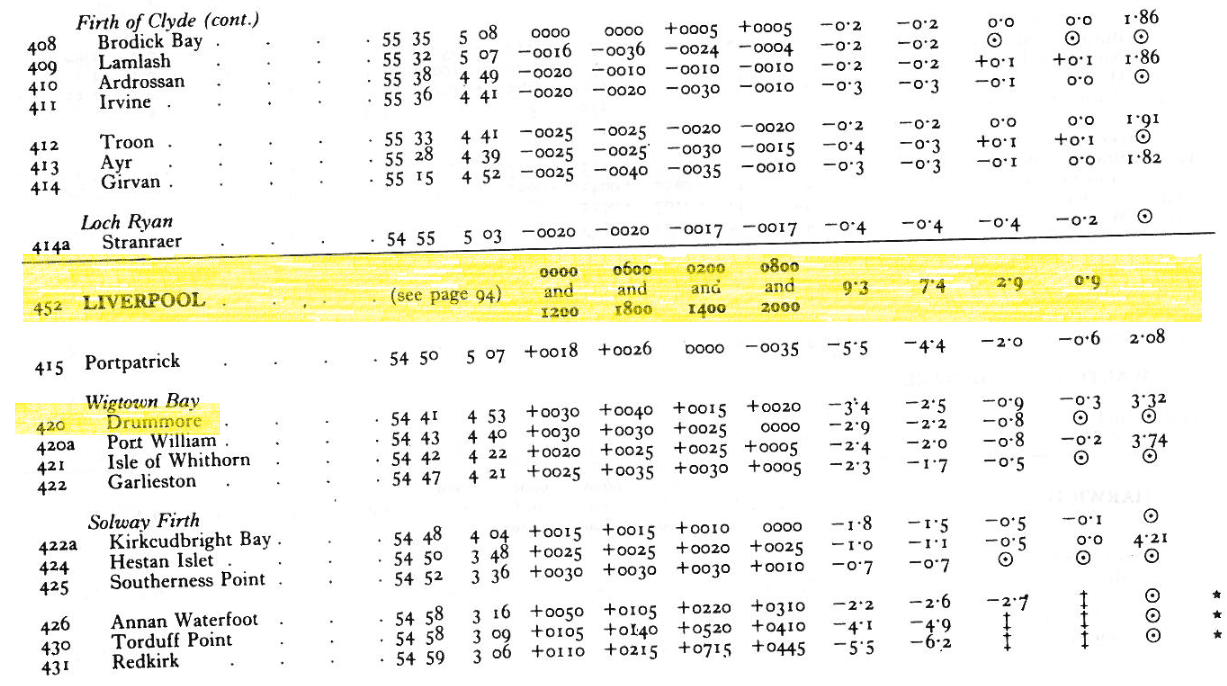
From above we can see that the standard port is Liverpool
Step 2; Now note down the daily prediction for Liverpool on 10th APRIL 1992.
Step 3: Now go back to the correction for secondary port page for Drummore here the first step is to apply the time correction.

For the standard port you can see the following values:

And the time correction for Drummore is as follows
And the local times for the standard port on 10th April is as follows
We need to interpolate the correction for the above timings, as the correction given is for a certain time range i.e 0000 and 1200 etc.
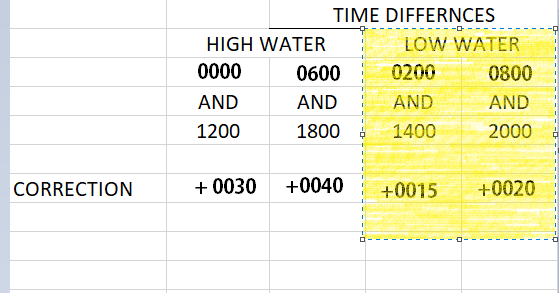
Step 4: Write down the Time differences and correction in the following format.

First we will solve for the high waters.

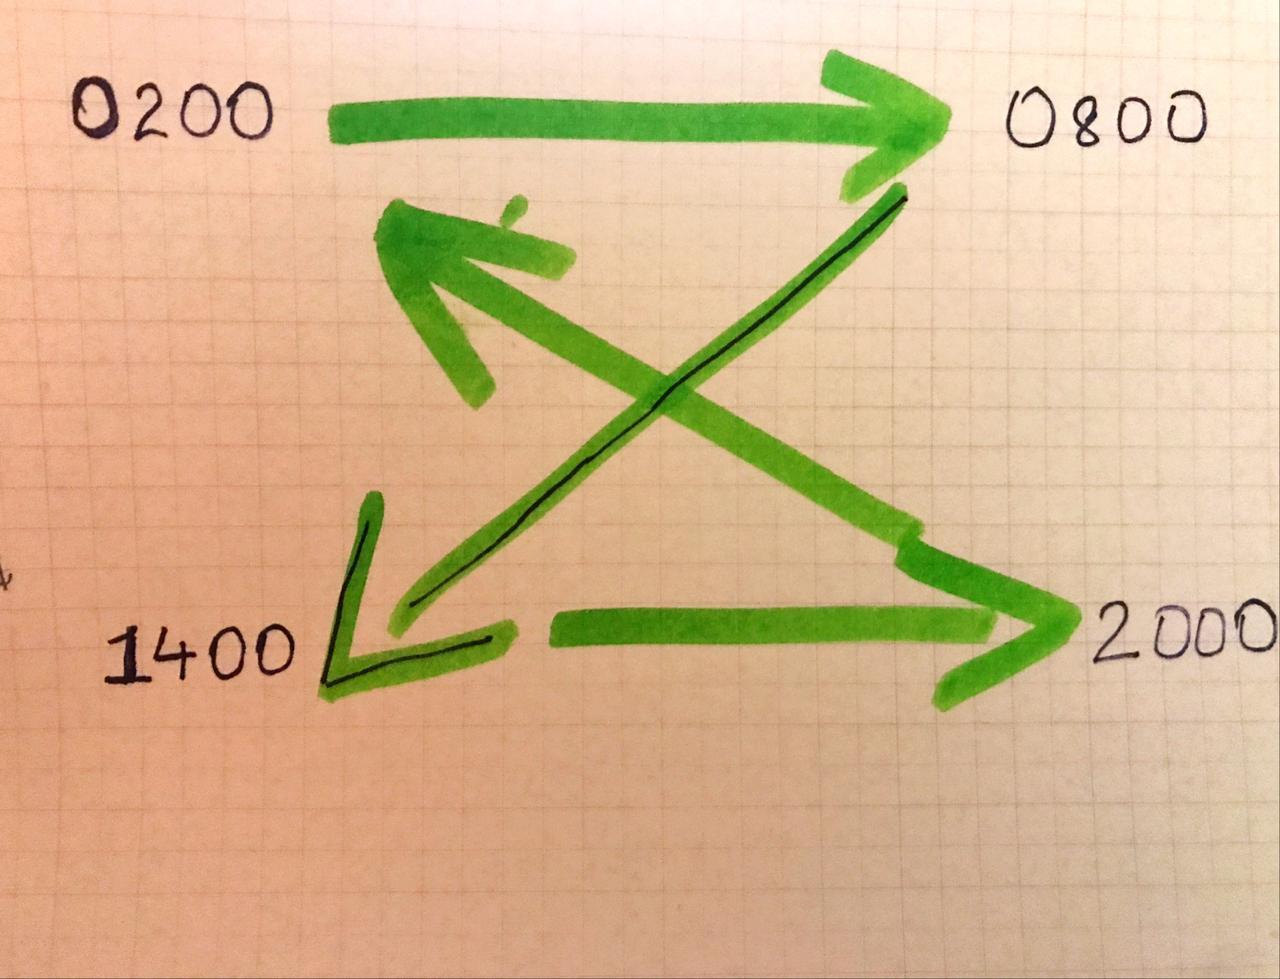
1.You can observe that the time difference is similar to a clock i.e. 0000hrs > 0600hs> 1200hrs > 1800hrs.
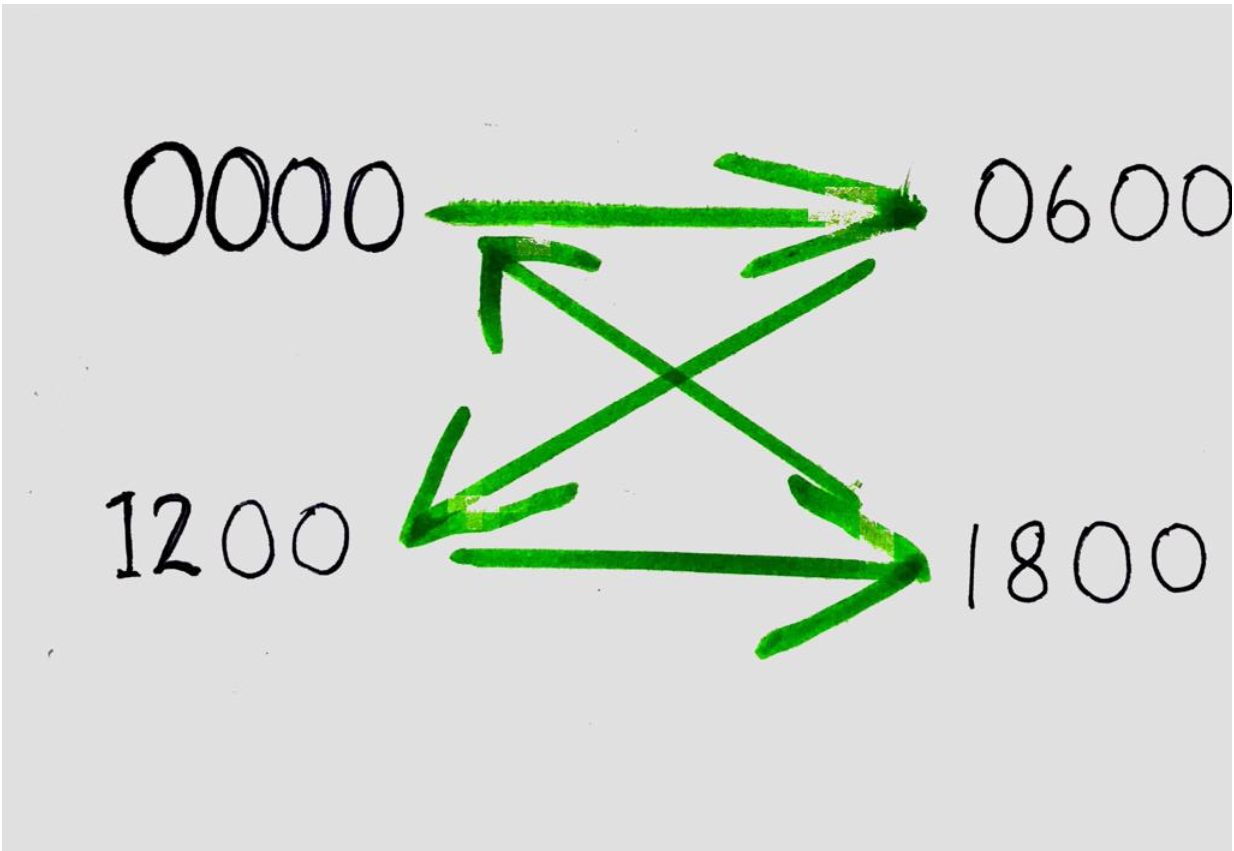
Use the same order while using the values for interpolation.
2.The first value for interpolation is 0338 hrs, this lies between 0000 hrs and 0600hrs
3.We know for 6hours [0000-0600] (360mins) –> difference in correction is (0040-0030) = 0010 i.e. 10 mins
4.So for 03:38 hrs [i.e. 0000-0338] (218 mins)-> (218*10)/360 = 6.05 mins
5.So this value of 6.05 mins is added to +0030 as we are moving from 0000 to 0338 and the value of correction is increases as we move from 0000 to 0600, so the interpolation is added. Then the correction value obtained is +0036.05 ~ 0036.1

6.If in step 4 we would subtract 03:38 from 06:00 i.e. [06:00-03:38] we get 02:22(142mins)
And upon doing the same interpolation i.e. (142*10)/360 = 3.95mins
This value has to be subtracted from +0040 as we are moving from 0600 to 0338 and the value of correction decreases as we move from 0600 to 0000, so the interpolation is subtracted. Then the correction value obtained is + 0036.5 ~ 0036.1 which is similar to the one obtained in step 4.
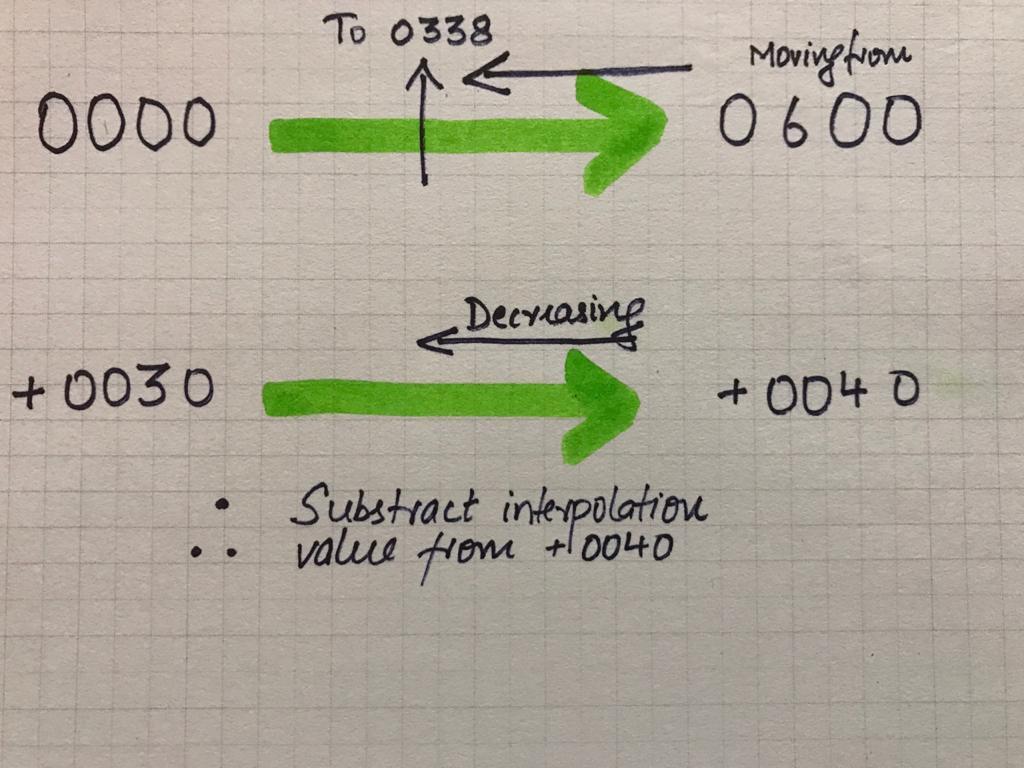
So we obtain the correction value as +0036.1.
This correction value is added to the high water time for standard port i.e. 0038+0036.1 =0414.1 hrs, this is the corresponding time at the secondary port.
Now for the second-high water which is at 1623 HRS which comes between 1200 to 1800, the interpolation is done as follows
(16:23 -12:00) =263mins
(263*10)/360 =7.31 mins
This is added to +0030 therefore final correction value is +0037.05
Thus corrected time for secondary port is 1700.3 hrs.
Step 5: For Low waters: The procedure is similar to that we did in high waters. Only difference is that we use the low water timings and the time differences for low water.
1.The first low water is at 1030 hrs
* This comes in between 0800 and 1400 hrs, the interpolation is done as follows;
* 1400-0800=0600hrs=360 mins, now difference in correction between this period is 0020-0015 =0005 hrs= 5 mins.
* Therefore (10:30-08:00) =(150mins)
So (150*5)/360 =2.08 mins
Since we are moving from 0800 to 1400 we will subtract this correction from +0020, i.e. 20-2.08=17.92mins or +0017.92
Add this to the standard port time i.e. 1030 + 0017.92 =1047.9hrs.
2.The second low water is 2255 hrs
* 2255hrs comes in between 2000 and 0200 therefore while finding the interpolation value we get
* (22:55-20:00) = 2:55=175mins
* Interpolation value = (175*5)/360 =2.43 mins
* Since we are moving from 2000 hrs to 0200 hrs the interpolation value is subtracted from +0020 i.e. 17.6mins or 0017.6
* Add this to standard port time, we get: 22:55 + 0017.6 =23:12.6hrs
Step 6: Therefore, we have obtained the secondary port daily timing for 10th April which is as follows:
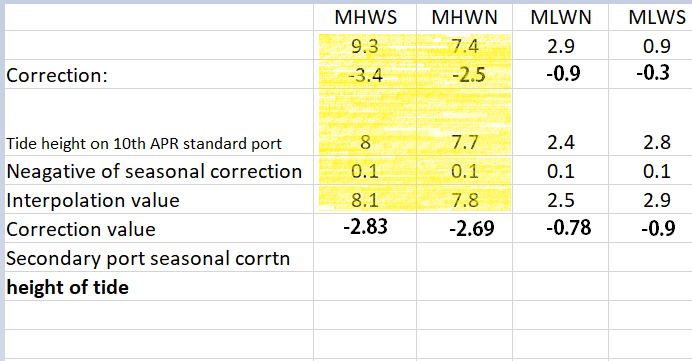
Step 7: Now we need to find the height of tide for that we have the tide correction factors for Drummore and value of MHWS, MHWN, MLWS, MLWN for Liverpool. We will determine the height of tide using these values.
Step 8: Create a table as follows it helps in solving the sum without confusion.

Step 9: Find the seasonal correction for the standard port and apply the negative of that value to the height of tide for standard port on 10th April.

The port number for Liverpool is 452 therefore we get the seasonal correction as -0.1.Applying the neagtive correction we get the imterpolaton value.

Step 10: The values thus obtained are the interpolation value, we will use these values and obtain the correction values to obtain the height of tide.
The correction given in the tide table is for the values of MHWS,MHWM,MLWS,MLWN.
So we to interpolate using these values to find the correction for the interpolation value.
Lets do the interpolation of High waters first.

First value to interpolate is for 8.1
9.3-7.4=1.9
3.4-2.5 = 0.9
Thus for 1.9 🡪 0.9
Therefore for (9.3-8.1)=1.2, (1.2*0.9)/1.9 =0.57
Since 8.1 is inbetween 9.3 and 7.4 , thus we have to subtract the interpolated value from 3.4 , because the value is reducing ( from 3.4 to 2.5, here we have not considered the –ve sign, that will be used while making the correction in the table)
Therefore correction for height 8.1 is 3.4-0.57=2.83
Similarly we find out the correction values for 7.8m as 2.69
Then we carry out interpolation of the Low waters.

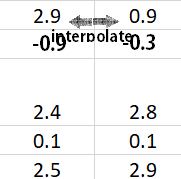
Now for interpolating the low waters:
First value is 2.5 mtrs.
2.9 -0.9 =2
0.9-0.3 = 0.6
So for 2🡪 0.6
Now for (2.9-2.5) =0.4 ; (0.4*0.6)/2 =0.12
Since 2.5 is smaller than 2.9 we will habe to substract the interpolated value from 0.9
Thus the correction value is 0.9-0.12=0.78
The next low water is 2.9 for which the correction value is same as the one given in ATT i.e. 0.9
Step 11: Write down the correction values for the high and low waters.
Step 12: Find the seasonal correction for the secondary port .

For Drummore the port number is 420.
Step 13:Add the Interpolation value , the correction value and the seasonal correction for the secondary port, keep the sign as it is in the table.
Therefore our table looks like this after summing up.
THUS THE DAILY PREDICTION FOR SECONDARY PORT ON 10th APRIL IS AS FOLLOWS:
TIME TIDE
SOME POINTS TO REMEMBER:
1.You can extrapolate the heights if needed .
In this case 2.5 lies between 2.9 and 0.9 thus we are interpolating between these numbers, but lets say the interpolation value is 3.0 mtrs, then we extrapolate ie move away from 2.9.

3.TO DETERMINE THE INTERMEDIATE TIME/HEIGHT OF TIDE FOR THE SECONDARY PORT.
Step 1: Determine the daily predictions for the Secondary port using the method above.
Step 2: In volume 1 you will have to determine the curve, for determining the curve always use the range (height difference) of the STANDARD PORT.
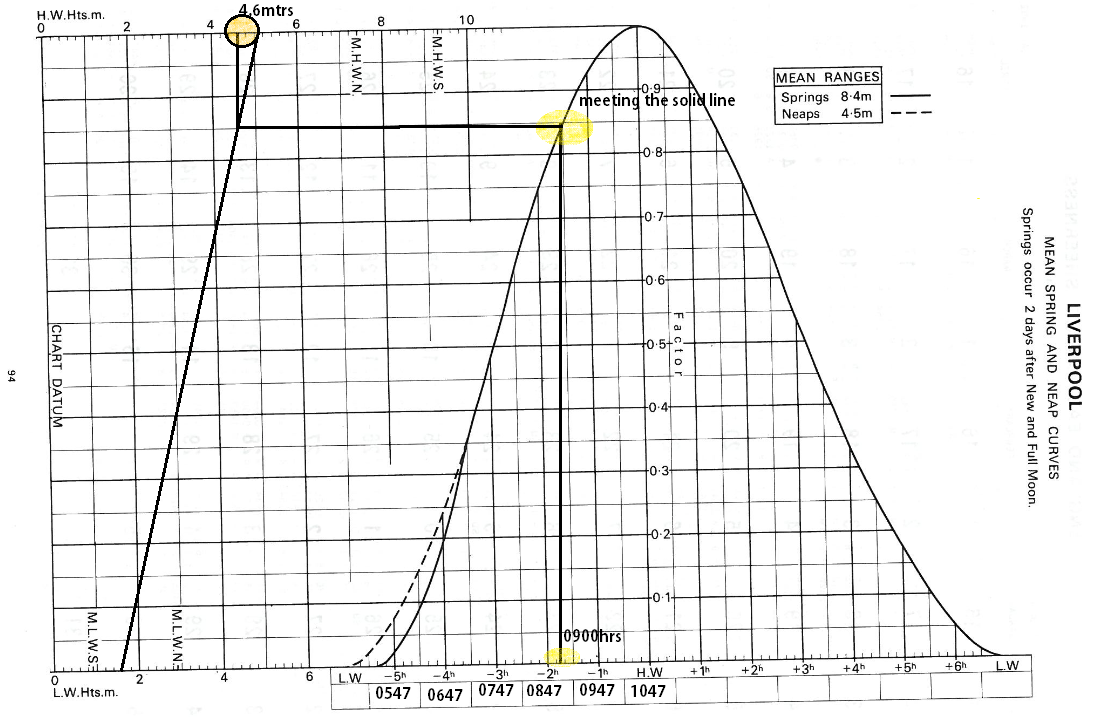
Suppose we are asked to find the height of tide at Drummore on 10th April at 0900hrs.
To determine the curve, we need to use the Standard port daily value for 10th April.
Range of tide at standard port is 8-2.4 =5.6mtrs
Now on observing the values of MHWS and MHWN we can say that we would have to interpolate, but the 2 curves merge at a point and since 0900 hrs comes around 1hr 47 mins before high water at Drummore, upon drawing a vertical line from 0900rs it will meet the solid line. Therefore, interpolation is not required.

Step 3: TIME TIDE
0900 hrs falls between 0414.4hrs and 1047.9 hrs, mark the high and low waters on the scale and draw a line joining them.
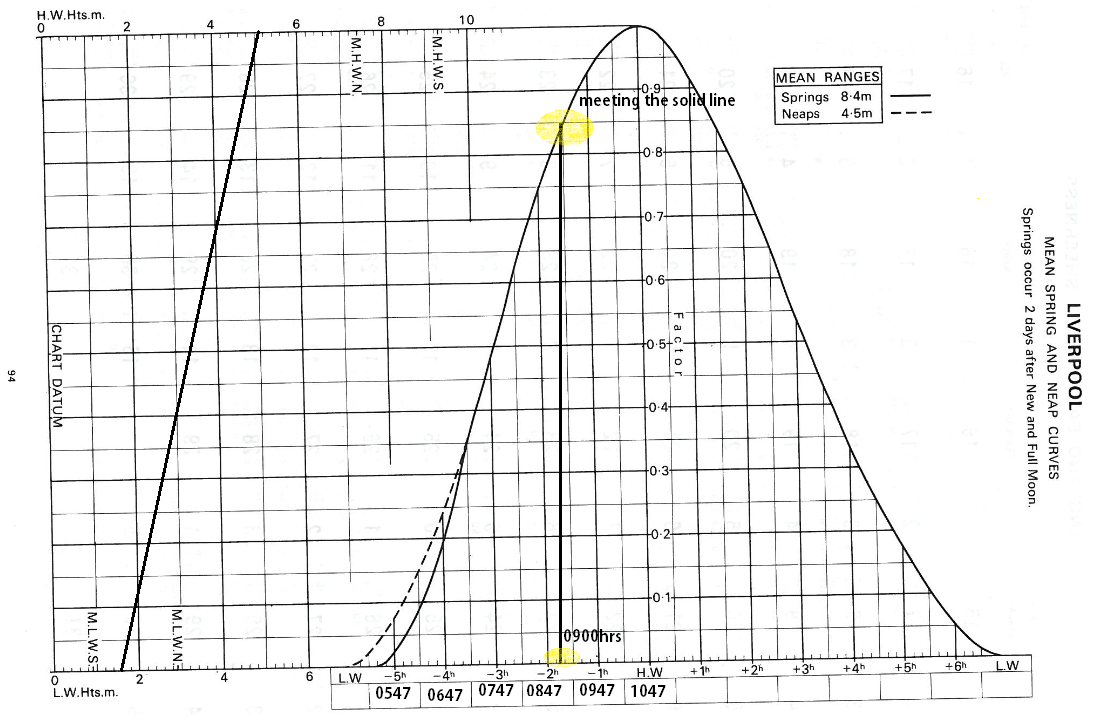
Now draw a horizontal line from the point where the vertical line meets the curve, this meets the slanted line at a point, from this point draw a vertical line to the HW scale.
Therefore, we get the height of tide at 0900hrs as 4.6 mtrs.
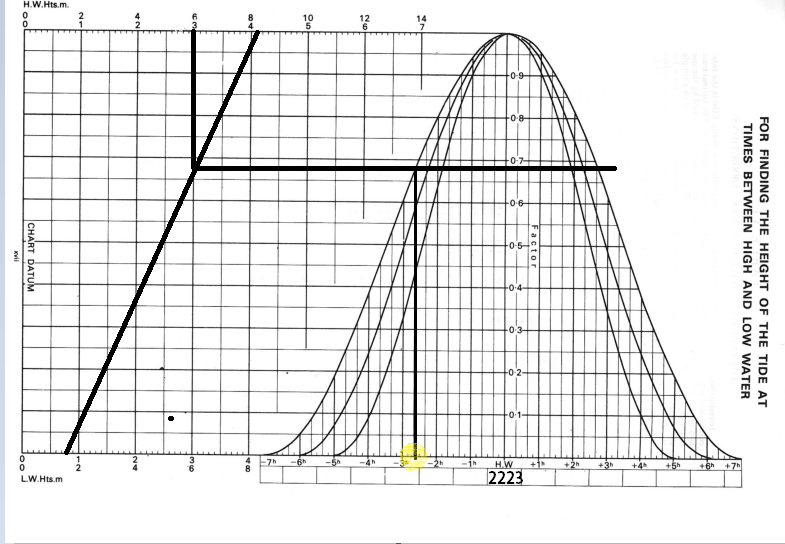
Layout and points to remember in Vol 2 and 3.
The major difference between volume 1 and 2,3 is that volume 1 standard ports have an individual curve for each standard port, whereas for vol 2 and 3 we have a single curve for all the standard ports.
In the curves in vol 1 you observed a solid and pecked line, but the curve in vol 2 and 3 have only solid lines.(3 different curves)
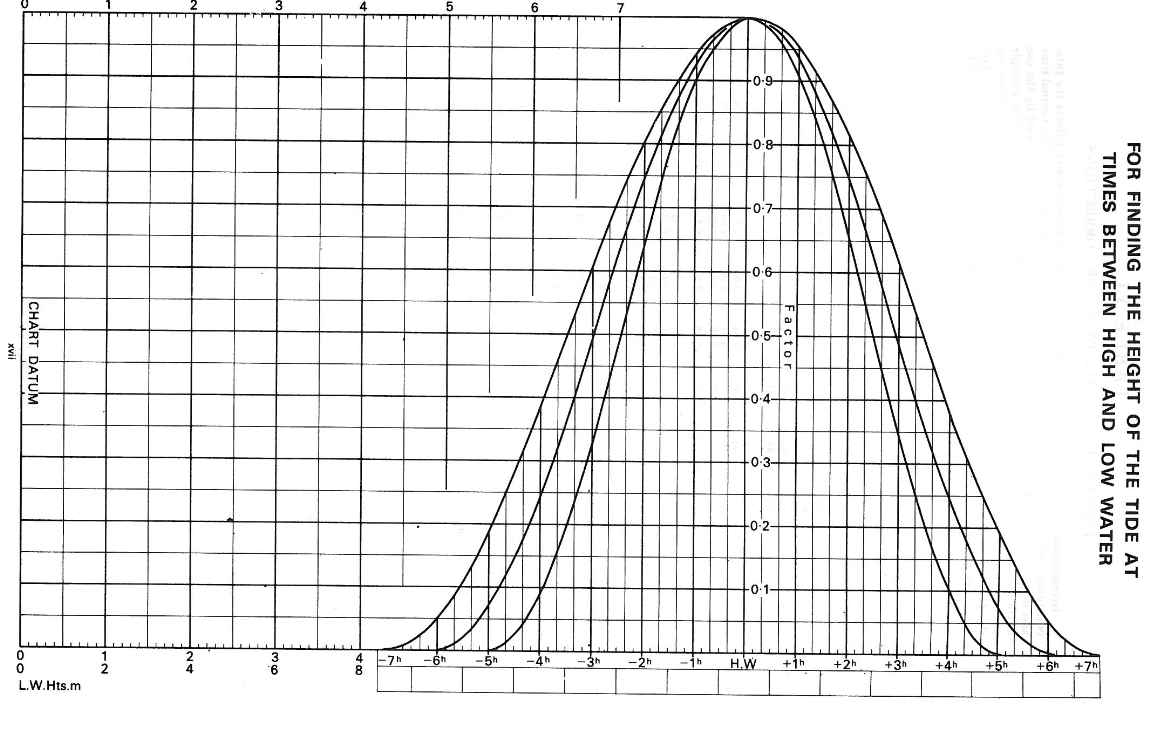
In volume one we used the range of tide of standard port for the choosing the curve, whereas in volume 2,3 we use the duration of tide (difference in high and low water timings) to determine the curve.
For using the graphs and traditional method (using graphs and interpolation) a condition has to be satisfied i.e. the time difference between 2 successive tides should be between 5 to 7 hours.
If this is not satisfied, we have to use SHM method (not in 2M syllabus)
While calculating the daily predictions for secondary ports the time interpolation for secondary port is not to be carried out in vol 2 and 3.

NUMERICALS BASED ON VOL 2 and 3;
Numerical in volume 2 and 3 are of similar pattern, so we will solve one type problem for vol 2, the procedure would be similar for vol 3.
1.To determine the intermediate timings/tide at a standard port.
FIND THE HEIGHT OF TIDE AT BHAVNAGAR on 1st JAN 1992 at 1830hrs.
Step 1: Note down the daily predictions for Bhavnagar for 1st Jan.
Step 2: 1830 hours comes in between 1504 and 2132 and also 3h and 27m after high water at 1504, so we will use the right hand side of the curve, make the entry in the curve and draw a vertical line from 18:30 hrs on the time scale.
Step 3: Now we will find out the duration of the tide, which is simply the difference in the timings of the high and low waters.
i.e. 21:32 – 15:04 =6h 28m
Now as you can see we have 3 curves here, one for +5h, one for +6h and one for +7h, so 6 h 28m will lie between the curve for +6h and +7h, therefore we have to interpolate to obtain a new curve for the 6h 28 min.
Just like how we did the interpolation in vol 1, take 3 to 4 points where you will interpolate and make a section of the curve.

Step 4: Mark the high and low waters on the scale and join them by drawing a line.

Step 5: From the point where the vertical line meets the newly made curve draw a horizontal line to the slanted line, this meets at a point, from there draw a line vertical up where it meets the Hw scale, this is height of tide.
Height of tide is 2.6 mtrs at 1830hrs.


2. Determining the Daily predictions for a secondary port.
FIND THE DAILY PREDICATION FOR BHARUCH on 2ND JAN 1992.
Step 1: In the MMD questions the port number would be given, So identify the Standard port for the port Bharuch.
For Bharuch the standard port is BHAVNAGAR.
Now note down the daily predictions for Bhavnagar for 2nd JAN.
Step 2: Now we need to apply the time correction to get the daily prediction times for Bharuch.

Under the time correction for Bharuch you can see for high waters +0210hrs and for low waters it is +0525 hrs.
So all you have to do is add these corrections to the high waters and low waters time for standard port. (unlike vol 1 no interpolation required here).
High waters at standard port 0329hrs and 1555hrs
Low waters at standard port 1034hrs and 2220hrs.
So to determine the daily timings at Bharuch
Add +0210hrs to the high waters at standard port.
03:29hrs + 0210 =0539 hrs (2nd Jan)
15:55hrs + 0210 =1805 hrs (2nd Jan)
Add +0525 hrs to the low waters at standard port.
10:34 + 0525 = 1559hrs (2nd Jan)
22:20 + 0525 = 0345hrs (3rd Jan)
So we have got 3 entries for the secondary port on 2nd Jan. And one entry for 3rd Jan, but we need the entries for 2nd Jan for the secondary port, so what we do is take one entry(last) from the previous day i.e. on 1st Jan at Bhavnagar.
So on 1st Jan
2132 hrs -> 2.3 mtrs. If we add the low water correction for Bharuch to this time, we get 21:32(1st Jan) + 0525= 0257hrs (2nd Jan)
Now we got all the timings for the secondary port on 2nd Jan. Which is as follows:
Step 3: Now we need to find the height of tide at secondary port, so first we will make the table just like the way we made it in vol 1 solutions.
The standard port timings and height of tides is as follows:

Step 4: Now let’s find the seasonal correction for standard port and apply the correction. Apply the negative correction to the obtained seasonal correction.

We can see it is 0.0 for Jan (Bhavnagar Number is 4346).
After applying the correction, we get the interpolation value, so make the entry in the table as follows:

Step 5: Now we need to find the correction factors for the interpolation values, the correction values given readily in the ATT is for the MHWS, MHWN, MLWN, MLWS.
Let’s calculate for HW first.
For 10.1 mtrs:
10.2 - 8.3=1.9
7.4 – 6.9 = 0.5
So for 1.9 ->0.5
We need to find for (10.2-10.1) =0.1, which is (0.1*0.5)/1.9 =0.026
Since 10.1 is lies between 10.2 and 8.3, we subtract the 0.026 from 7.4
Thus correction factor for 10.1 is 7.4-0.026=7.374.
For 7.7 mtrs:
10.2 - 8.3=1.9
7.4 – 6.9 = 0.5
So for 1.9 ->0.5
We need to find for (8.3-7.7) =0.6, which is (0.6*0.5)/1.9 =0.158
Since 7.7 is lesser than 8.3 we are moving away from 8.3, and the correction factor decreases as we go from 10.2 to 8.3, so we subtract the value from 6.9.
Thus correction factor for 7.7 is 6.9-0.158=6.742.
Let’s calculate the LW now:
For 2.3 mtrs:
3.5 -1.4 = 2.1
3.2 – 0.6 = 2.6
So for 2.1 -> 2.6
We need to find for (3.5-2.3) =1.2, which is (1.2*2.6)/2.1 = 1.486.
As 2.3 lies between 3.5 and 1.4 we need to subtract the value from 3.2
Thus the correction factor for 2.3 is (3.2-1.486) = 1.714
For 2.8 mtrs:
3.5 -1.4 = 2.1
3.2 – 0.6 = 2.6
So for 2.1 -> 2.6
We need to find for (3.5-2.8) = 0.7, which is (0.7*2.6)/2.1 = 0.866.
As 2.8 lies between 3.5 and 2.8 we need to subtract this value form 3.2.
Thus the correction factor for 2.8 is (3.2 – 0.866) = 2.334.
Make the entry of the Correction factor in the table.

Step 6: Determine the seasonal correction for the secondary port (BHARUCH # 4352)
We get the seasonal correction as 0.0.
Step 7: Make the entry of the seasonal correction for secondary port and then add the Interpolation Value Correction value + seasonal correction for secondary port to obtain the height of tide.

Thus we obtain the height of tide for secondary port on 2nd Jan.
3. Determining an intermediate time/height of tide at secondary port.
In these cases, we will use the daily predictions of the secondary port itself, the standard port won’t be used. The solution would include the same steps as we did for standard port for vol 2.
SOME FEAUTURES OF THE CORRECTION PAGES:

If the shaded symbol in the above diagram is given under correction column it means that there is no data for correction

If the letter p is mentioned in the column it means that we cannot use the graph method, we need to use SHM method then.

Is Shallow water corrections are given as shown above, we can’t use the traditional method, we got to use the SHM method then
HEIGHT AND DRAFT PROBLEMS:

All depths on the chart are referred with the chart datum which is the lowest astronomical tide(LAT), but the tide can go below the Chart datum at some places which is mentioned as negative height of tide.
Similar to depths the chartered heights of the bridges , lighthouses are always referred with respect to MHWS and in some cases with the Highest Astronomical Tide(HAT).
From the image:
PRESENT HEIGHT is always measured from the present waterline.
DRAFT is always measured from present waterline to keel.
PRESENT DEPTH is always measured from present waterline to the sea bottom.
CHARTERED DEPTH: measured from the chart datum to the sea bottom.
MHWS: measured from the chart datum
CHARTERED HEIGHT: measured from MHWS
Height of tide is the vertical distance between the present waterline and the datum waterline.
FROM THE ABOVE INFORMATION WE CAN DEDUCE THE FOLLOWING EQUATIONS:
PRESENT DEPTH = CHARTERED DEPTH + HEIGHT OF TIDE
Or
DRAFT + UKC
PRESENT HEIGHT= AIRDRAFT + OVERHEAD CLEARANCE
Or
MHWS+CHARTERED HEIGHT- HEIGHT OF TIDE
We will use these equations to solve the numerical:
1.Given drafts fwd.=6mtrs and aft=7mtrs, the ship has to clear a bar of chartered depth = 6mtrs in BOMBAY on 15th feb with UKC=2 mtrs, find the earliest time in the evening when the vessel can do so.
Ans:
Always take the maximum draft, do not go for the mean draft or any other calculations are not required.
Here aft draft is max= 9mtrs (present draft)
We know present draft =Charted depth + height of tide
So
9 = 6+ height of tide
Therefore, height of tide required = 3mtrs.
Step 2: Determine the daily predictions for BOMBAY on 15th feb.
So in the question they have mentioned evening time, so we will consider the time period between 12:21 and 22:23.
Our required height of tide = 3mtrs.
REMEMBER: If you are asked for the earliest time, in the case of UKC questions always consider the rising tide.
Here the tide is raising from 15:21 to 22:23
Step 3: Now find the time difference, since it is VOL 2 port.
Time difference = 22:23 -15:21 = 07h 02 mins
Step 4: Mark the high water and low water on the scale.

Step 5: On the HW scale from 3m mark, draw a line vertically down, this will meet the slanted line at a point. From this point draw a horizontal line to the curves as shown below.


Step 6: Now to determine the curve, we since the duration is 7 hrs and 02 mins which is out of the 7h curve area, as we said before we never extrapolate the curve, use the -7h curve as the height of 3 mtrs will be achieved only before high water at 22:23.
Step 7: Draw a line vertically downwards from the point where the horizontal line meets the curve -7h, this line meets at point on the time scale, which would be about at 2h 42 mins before high water.
Step 8: To determine timing just subtract the high water timing from the value 2h 42 mins
So we get the required time as 19:41hrs.
NOTE: If they ask the candidate to find the “LAST TIME” to clear a bar, always use the falling tide and not the rising tide.
2.CLEARANCE TYPE QUESTIONS
Suppose we are asked to achieve a 1m clearance from a bridge while approaching a port in GERMANY on 6th feb 1992.We need to find the earliest time to pass the bridge with overhead clearance of 1 m.
Chartered height = 15mtrs
Airdraft present = 17mtrs
Ans:
We know Present height = Air draft + overhead clearance
= Chartered height +MHWS – Height of tide
From the curve we get the value of MHWS as 3.4 mtrs for Germany, this value of MHWS can also be found under the correction tables.
So, putting the values we get:
15+MHWS-height of tide = 17 + 1
15+ 3.4 – height of tide =18
So height of tide =0.4 mtrs.
Since they have asked the earliest time to pass, we have to use a falling tide.
Step 1: Note down the timings and height of tide
for Germany on 6th feb.
Since they have asked the earliest time, we use a falling tide, so we see that the tide from 02:30 to 09:24 is falling tide. We will use this duration.
Step 3: Determine the range of tide(Vol1), the rage is 3.4 mtrs (3.4-0), this value of 3.4 corresponds to the MHWS so we will use the solid curve.
Step 4: Join the high water and low water values on the scales.

Step 5: The required height is 0.4 mtrs which will occur after high water at 02:30, from 0.4 mtrs on HW scale draw a line vertically down, this will meet the slanted line at a point. From this point draw a horizontal line extending towards the right hand side of the curve meeting the solid line.

Step 6: From the point where the horizontal line meets the curve draw a line vertically down to the time scale, thus we get the time duration after high water when height of tide is 0.4 as 05h 25 mins after HW

Step 7: Apply this time difference to the high water, thus we get the time when height of tide is 0.4 mtrs as 07:55 hrs.
NOTE: IF IN THE SAME QUESTION THEY ASK THE LAST TIME TO PASS SO AS TO OBTAIN A CLEARANCE OF 1M USE THE RISING TIDE.
Difference between tidal streams and ocean currents:
Tidal streams are the horizontal movement of water at a place, caused due to tide raising forces, they change continuously with time.
Ocean currents are caused due to meteorological factors such as wind, pressure etc. It remains same for months.